x <- bayestestR::distribution_normal(5000, 800, 30)

plot_data <- data.table(
  `R-R interval (ms)` = x,
  `Z-Score (standardized units)` = (x - mean(x))/sd(x)
) |> melt.data.table(measure.vars = 1:2)

ggplot(plot_data, aes(value, fill = variable)) +
  facet_wrap(~ variable, scales = "free") +
  geom_density(show.legend = FALSE) +
  scale_y_continuous(expand = c(0,0,0.2,0), breaks = NULL) +
  scale_x_continuous(expand = c(0.1,0)) +
scale_fill_brewer(type = "qual", palette = 3)Introduction
Let’s talk about your heart. Not the metaphorical one that’s still recovering from that season finale of Stranger Things, but the actual meat-and-potatoes organ pumping in your chest. You know, the thing that goes haywire when you sprint for the bus or binge-watch Squid Game while eating a family-sized pizza all by yourself (that’s what I call self determination). Turns out, scientists (like yours truly) have been obsessed with understanding how this biological drum solo responds to exercise. And let me tell you, it’s not as straightforward as your Fitbit’s cheerful little heart icon would have you believe.
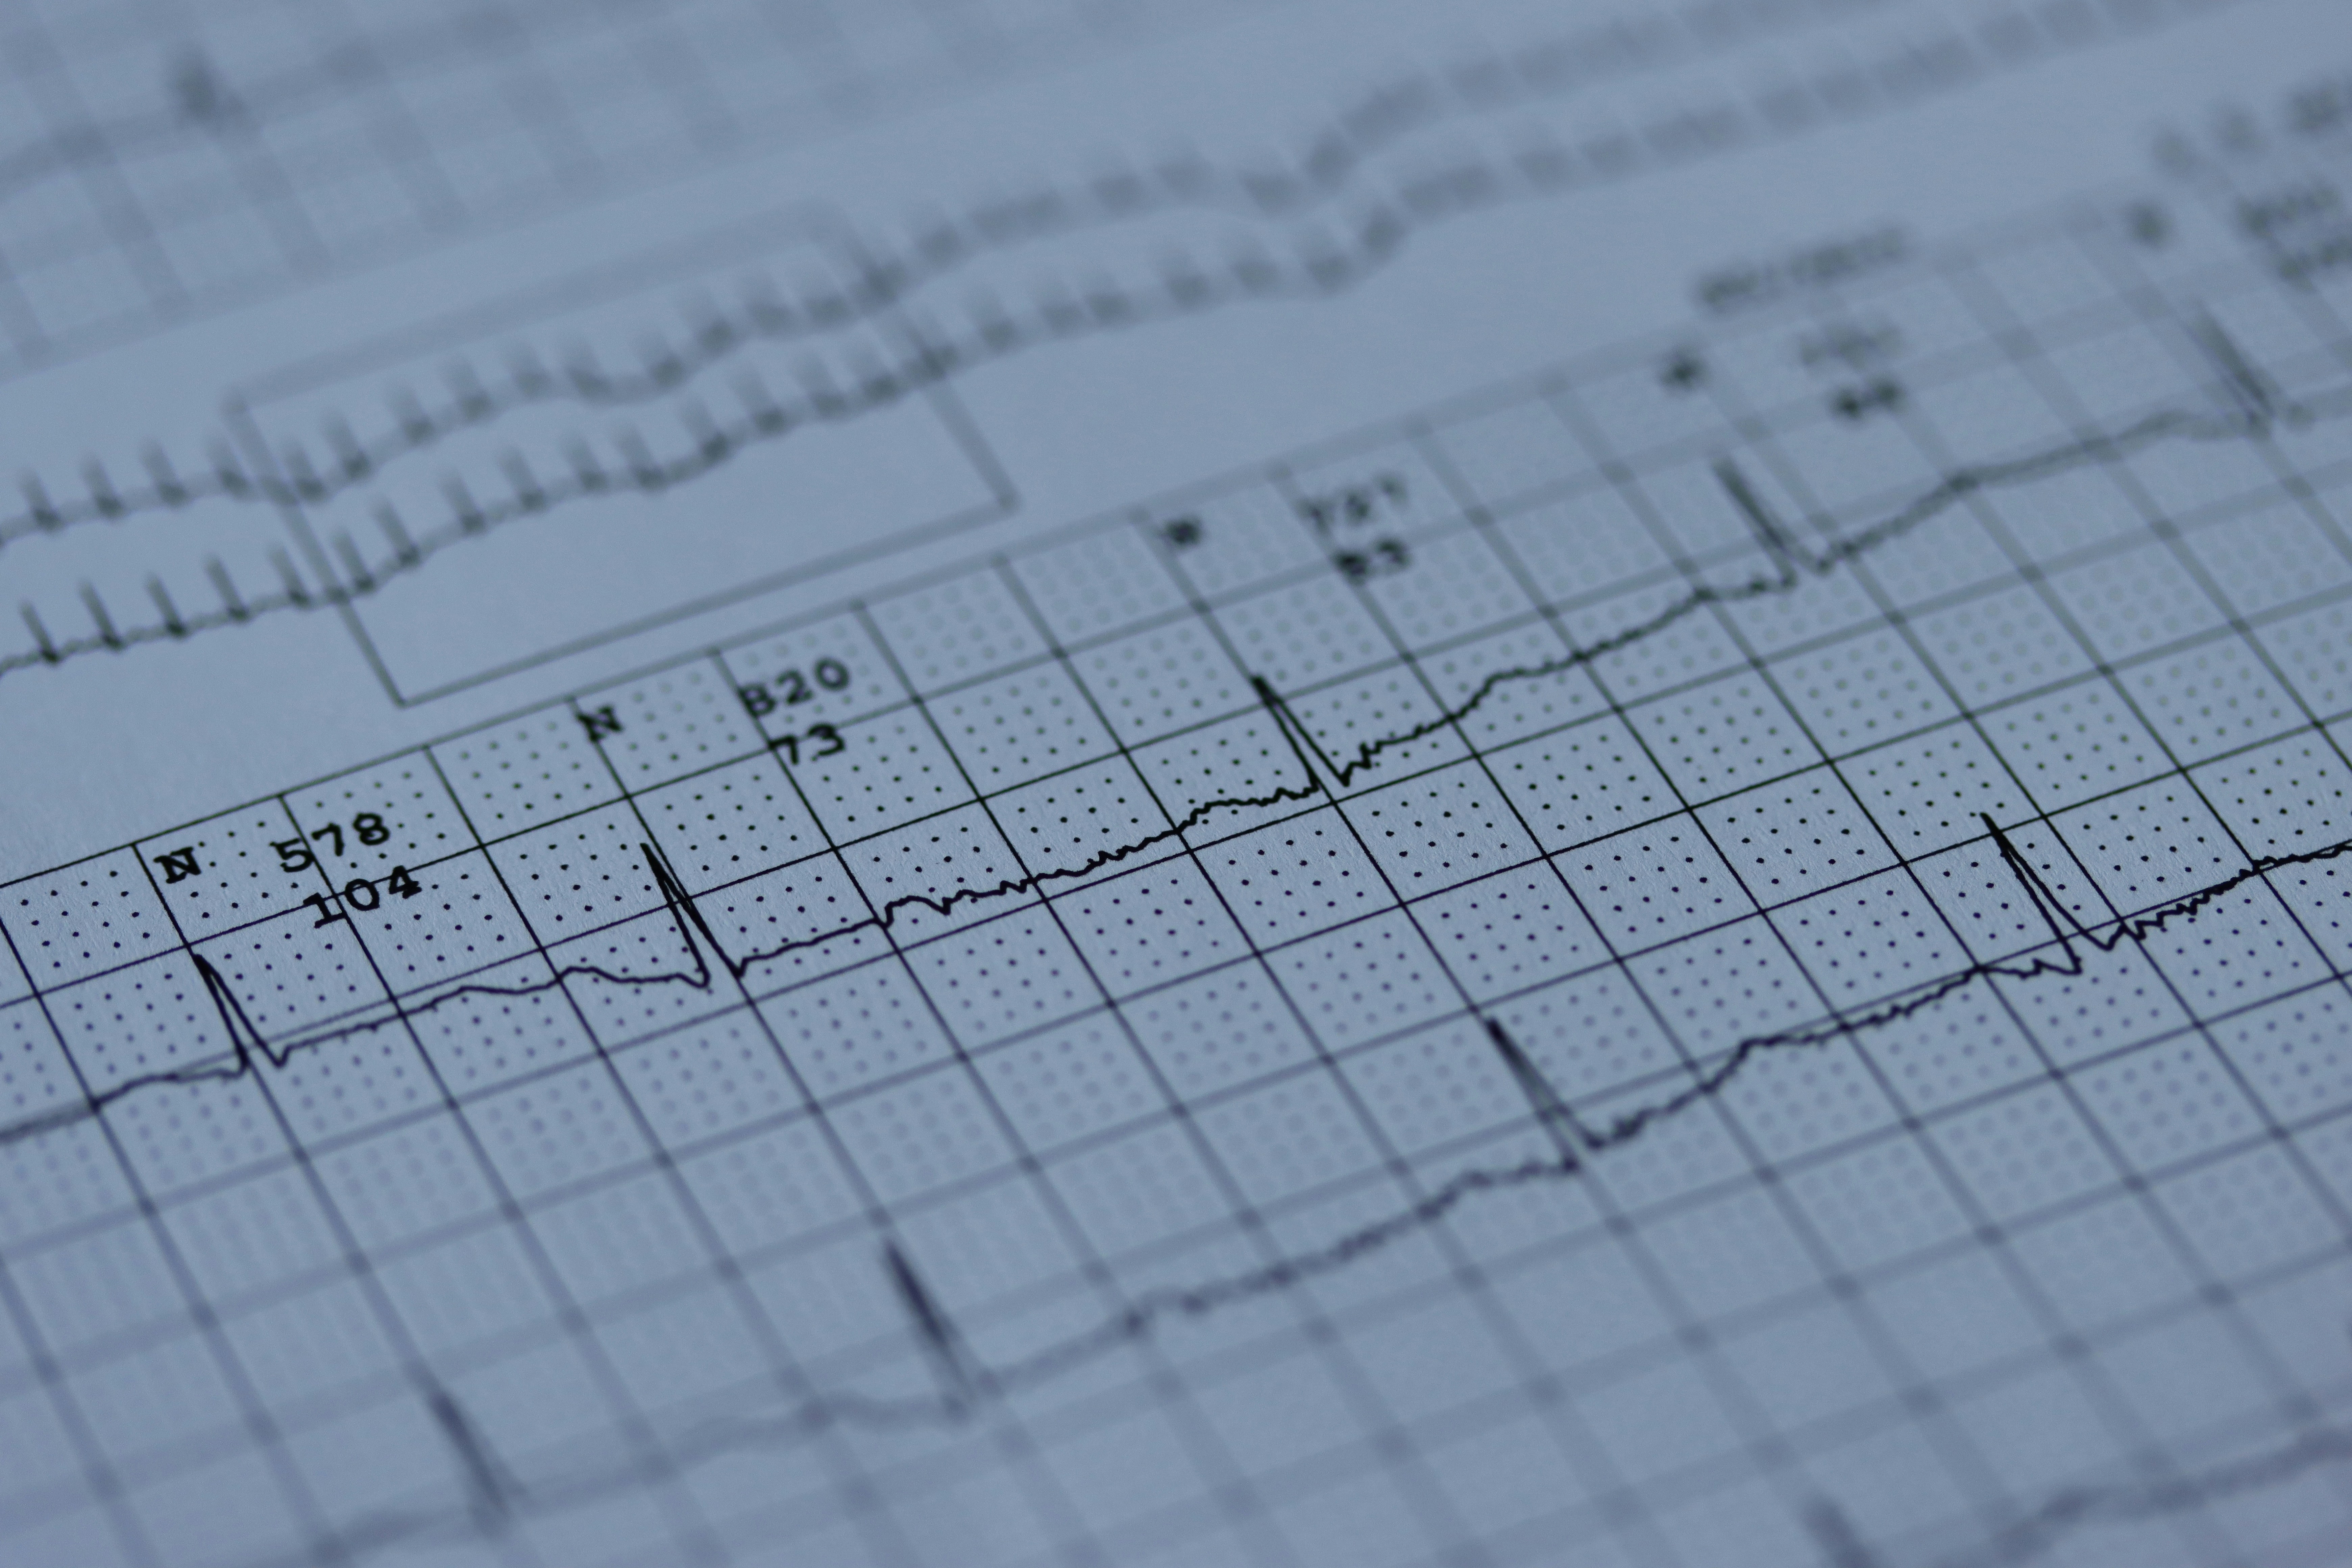
Your heart isn’t just a pump, it’s a poet. Every beat writes a tiny stanza in the epic of your life, and the R-R interval is the rhythm of that poetry. Technically, it’s the time (in milliseconds) between the peaks of consecutive heartbeats on an ECG, those iconic “R waves” that look like little skyscrapers. Shorter R-R intervals mean your heart is drumming faster (hello, panic-induced Zoom meetings), while longer R-R intervals mean it’s lounging (Netflix marathons, anyone?). Heart rate (beats per minute) is just the inverse of this: divide 60,000 by your RR interval, and voilà, you’ve got your BPM. But here’s the plot twist: your heart isn’t a metronome.
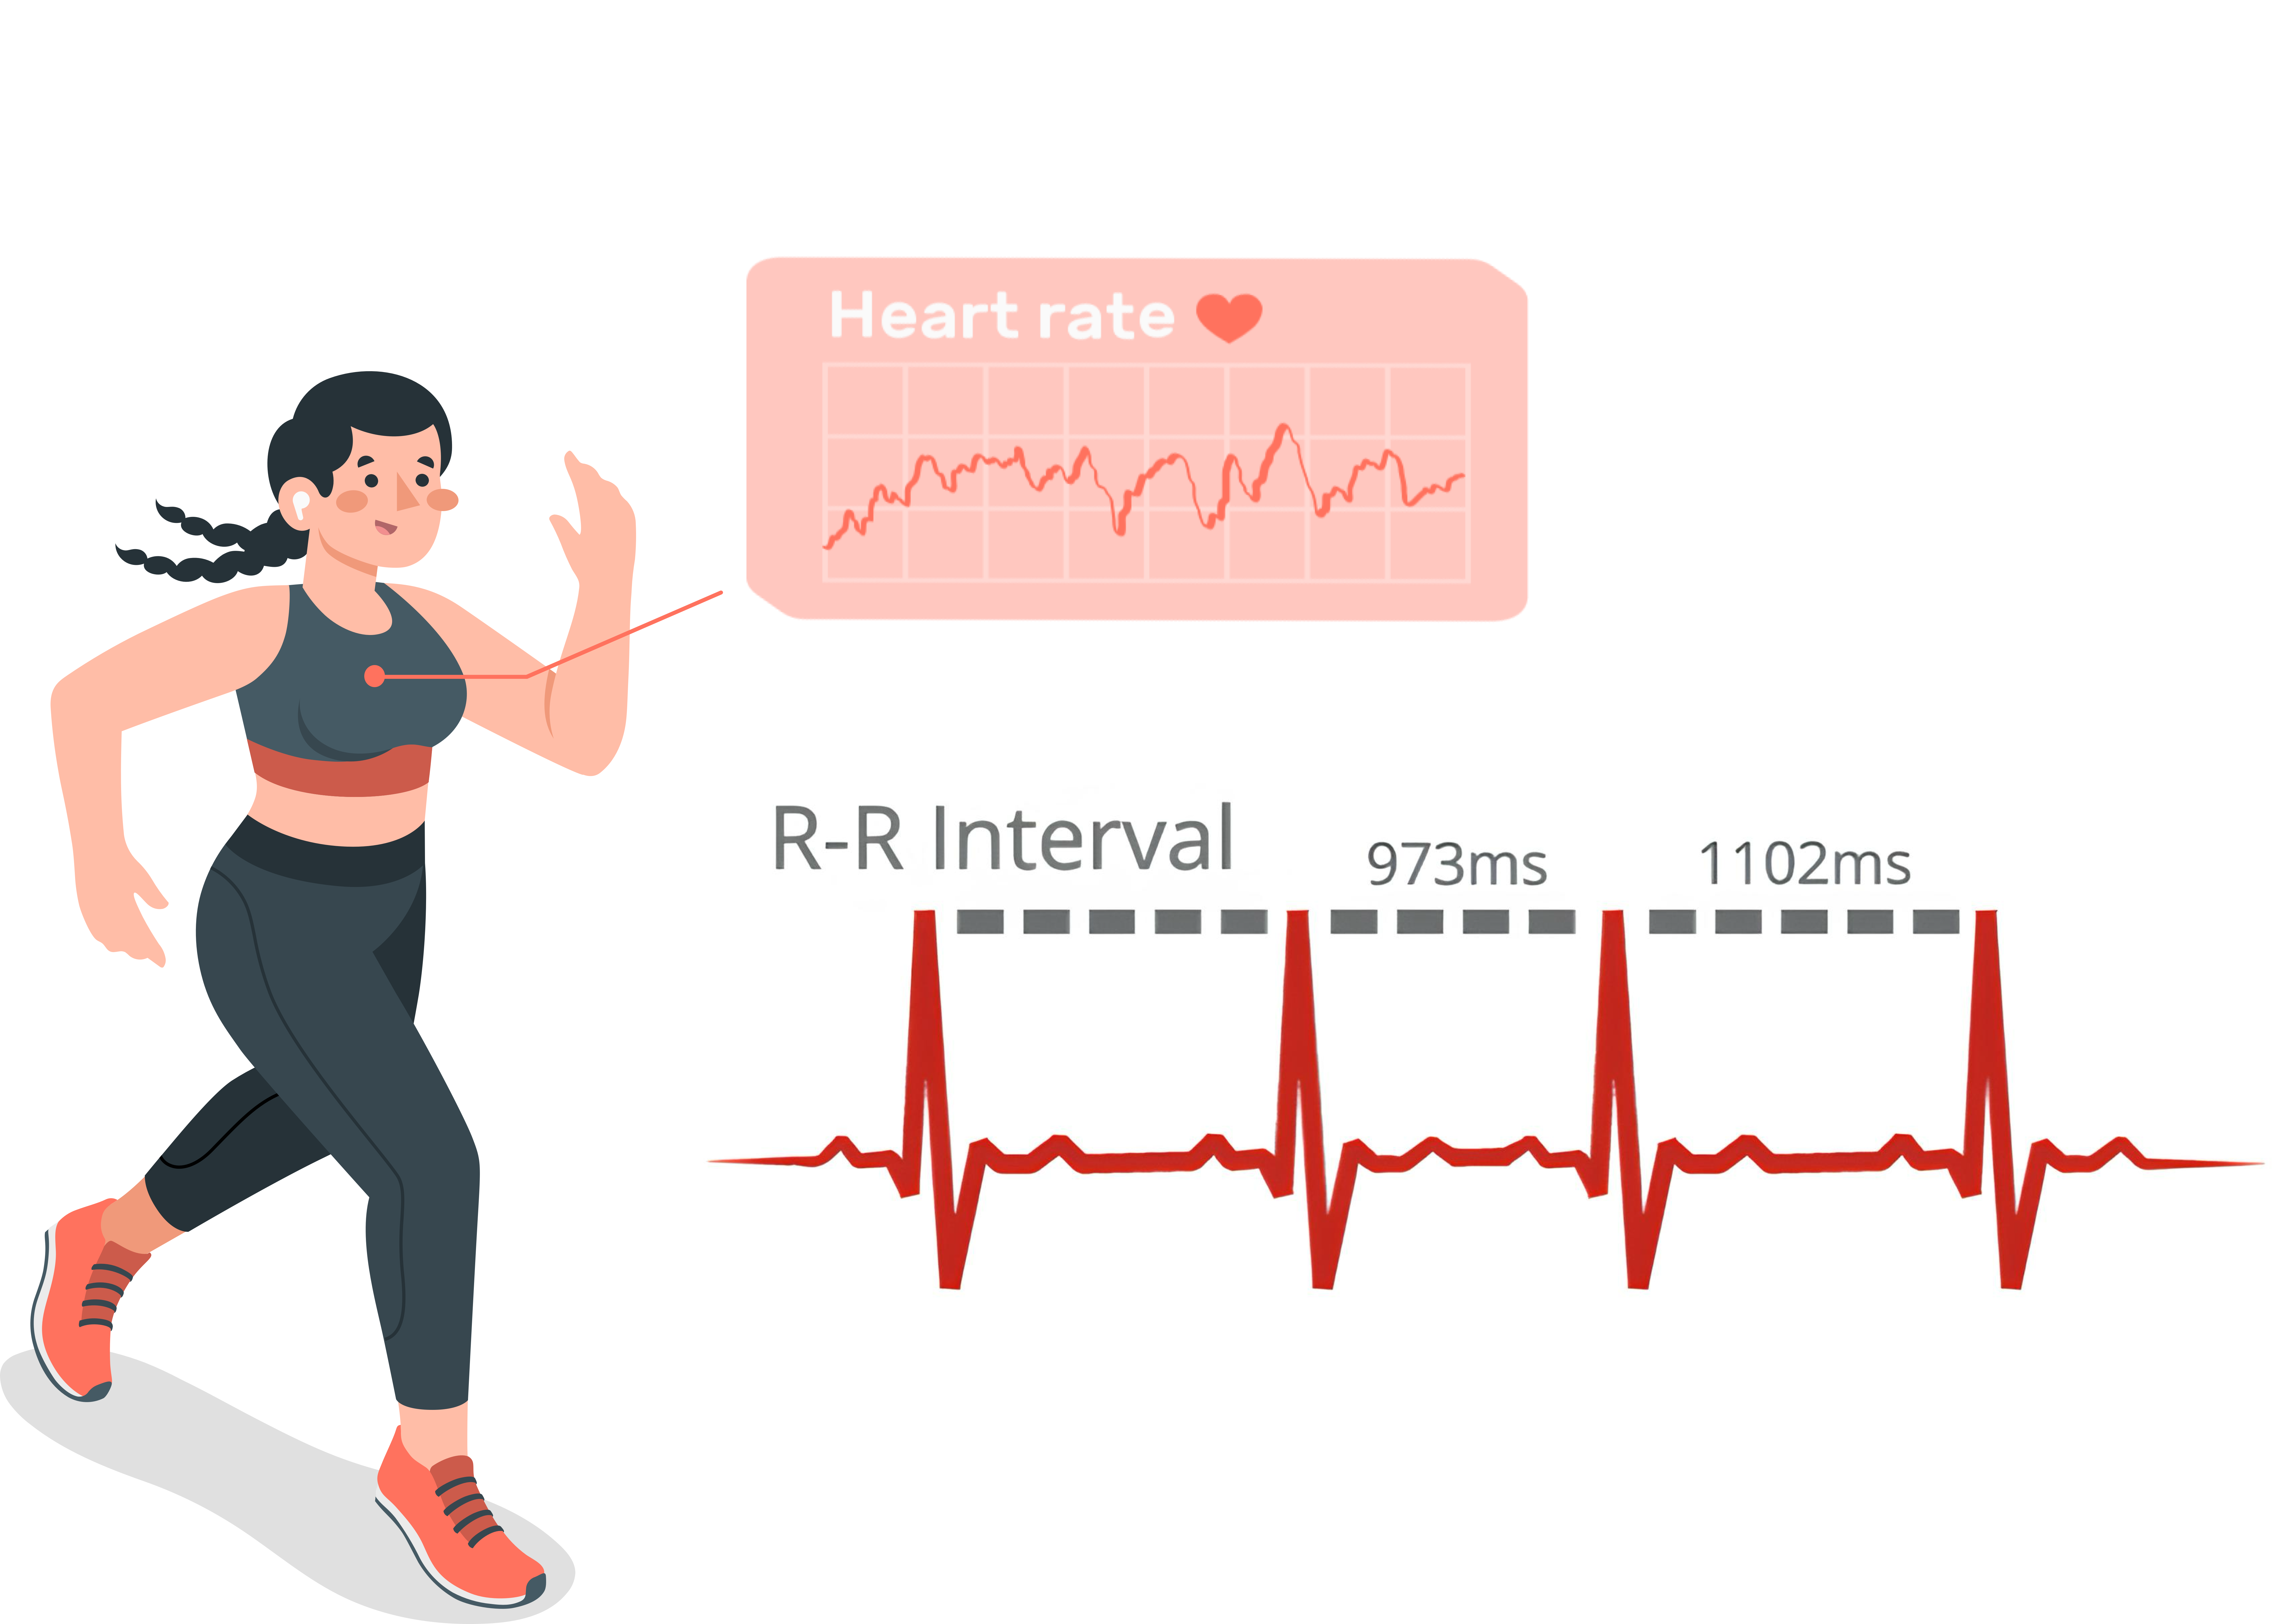
Enter heart rate variability (HRV), the hero of cardiac health. HRV measures the subtle variations between those R-R intervals. Think of it as your heart’s improv skills, jazz, not classical. High HRV means your autonomic nervous system is flexing its adaptability, seamlessly switching between “fight-or-flight” mode (sympathetic) and “chill-out” mode (parasympathetic). Low HRV? Your body’s stuck in a stress loop, like a hamster wheel of cortisol. But traditional HRV metrics average these fluctuations over minutes or hours, turning your heart’s freestyle rap into elevator music.
That’s where R-R intervals steal the spotlight. By analyzing them beat-to-beat, we catch the micro-dramas, how your heart panics during a sprint, recovers post-burpee, or side-eyes your third coffee.
Now imagine your heart rate during a workout is like the plot of a Christopher Nolan movie, full of twists, turns, and moments where you’re not entirely sure what’s going on but feel like it’s profound. Traditional methods for analyzing HRV are like trying to explain Inception using only a flip phone: technically possible, but missing all the nuance. For decades, researchers have relied on linear models and aggregated HRV metrics, which are about as useful for capturing the chaos of exercise-induced heart rhythms as a screen door on a submarine. Sure, they tell you something, but it’s like summarizing The Lord of the Rings as “some guys walked to a volcano.” Missing the point? Just a bit.

But hey! I have good news. We developed and published a new non-linear model, the Tony Stark of cardiac analysis, flashy, precise, and built in a cave (okay, a lab) with a bunch of math you’ll almost understand. Instead of forcing your heart’s beat-to-beat intervals (lovingly called R-R intervals) into the rigid straightjacket of linear equations, we’ve embraced the chaos with logistic functions. Think of it as upgrading from a dial-up modem to 5G. These logistic functions are the Beyoncé of math, versatile, dynamic, and capable of handling sudden shifts (like when you go from couch potato to HIIT warrior in 0.2 seconds). They model the heart’s nosedive during exercise and its slow crawl back to Netflix-and-chill mode afterward, all while spitting out parameters that actually mean something to your body. “Baseline R-R interval”? That’s your heart’s resting vibe. “Recovery proportion”? How quickly it forgives you for those burpees.
Now, let’s address the elephant in the room: why should you care? Well, unless you’re a cyborg (looking at you, Boston Dynamics), your autonomic nervous system, the puppet master behind your heart’s rhythm, is a drama queen. During exercise, it’s a tug-of-war between the “fight-or-flight” sympathetic system (the one yelling GO!) and the “chill-out” parasympathetic system (the one whispering maybe just one more episode?). Traditional models treat this like a seesaw with one kid glued to the ground. The model that we developed? It’s the entire playground, complete with swing sets, monkey bars, and that one kid who definitely ate too much sugar.
Here’s where it gets spicy: we tested this bad boy on 272 elderly folks. Why seniors? Because if your heart can handle Zumba at 70, it’s basically the Dwayne Johnson of organs. Spoiler alert: the model nailed it. With an R2 of 0.868 (translation: it’s scarily accurate) and RMSE of 32.6 ms (translation: it’s precise enough to detect your existential crisis during plank holds), it’s like giving doctors and trainers a cheat code for your cardiovascular health. Oh, and we used Hamiltonian Monte Carlo for parameter estimation, which sounds like a spell from Harry Potter but is really just math jedi tricks for “we didn’t guess, we calculated”.
But wait, there’s more! Using Sobol sensitivity analysis (a fancy way of asking, “Which part of this equation is doing the heavy lifting?”), we discovered that baseline R-R intervals and recovery proportion are the MVPs of heart rate dynamics. Translation: your heart’s default setting and its ability to bounce back post-workout are the LeBron and Jordan of this game. The other parameters? They’re the benchwarmers. Useful, but not stealing the spotlight.
Now, let’s talk real-world applications. Imagine a future where your smartwatch doesn’t just shame you for sitting too long but actually understands your heart’s tantrums during spin class. Or where rehab programs are tailored not just to your fitness level but to your autonomic nervous system’s mood swings. This model isn’t just academic nerdery, it’s a gateway to personalized health tech that doesn’t suck.
Of course, no hero’s journey is complete without flaws. Our study’s cohort was mostly elderly women, which is like testing a new sports car exclusively on retirees driving to bingo night. Future work? Let’s throw in some college athletes, sleep-deprived parents, and that one friend who does ultramarathons “for fun”. Also, shoutout to R, the coding language we used to simulate this model. If R were a person, it’d be that friend who’s brilliant but insists on explaining everything in memes.
So, buckle up. In the next sections, we’ll dive into the code, the curves, and the “aha!” moments that made this paper possible. Whether you’re a cardio junkie, a data science geek, or just someone who wants to know why your heart hates burpees, this ride’s for you. And hey, if you get lost, just remember: it’s not chaos, it’s science.
The Math, Code, and Cardiac Drama Behind the Model
Let’s peel back the layers of this model like it’s an onion, except instead of tears, you’ll get math, R code, and a newfound appreciation for your heart’s melodramatic tendencies. Buckle up; we’re going full Sherlock Holmes on this equation.
The Grand Equation: A Symphony of Sigmoids
At the heart of our model lies this beauty:
This isn’t just alphabet soup. It’s a carefully orchestrated dance between two logistic functions (the S-shaped curves you’d recognize from population growth or zombie apocalypse models). Together, they capture your heart’s journey from Zen-like rest to exercise-induced panic and back to Netflix mode. Let’s dissect each term like it’s a Breaking Bad episode.
1. Baseline R-R interval (
In the code,
Check how the transformed distribution of R-R intervals maintains its shape but only changes the reference scale. The standardized scale will always be in terms of standard deviations (also known as Z-score) as unit of measurement:
2. The Panic Parameter (
The first logistic term,
In R, simulating this is a breeze:
f1 <- function(t, alpha, beta, lambda, tau) {
  alpha + beta / (1 + exp(lambda * (t - tau)))
}
Plug in
3. The Drop Rate (
The code snippet for this term is deceptively simple, but the real magic is in the exponent:
4. The Recovery Squad (
After the storm comes the calm, or at least, your heart’s attempt at it. The second logistic term,
In code:
f2 <- function(t, beta, c, phi, delta, tau) {
  (-c * beta) / (1 + exp(phi * (t - tau - delta)))
}
This term is essentially a mirror image of the first logistic curve, flipped upside down (thanks to the
5. The Full Picture: From Rest to Chaos to Redemption
Combine both terms, and you get the complete RRi trajectory, a symphony of stress and recovery. The first logistic function models the sympathetic nervous system’s hold my beer moment, while the second captures the parasympathetic system’s I got you, fam.
Plotting this in R is where the magic happens:
time <- seq(0, 20, by = 0.05)
total <- f1(time, 860, -345, -3.05, 6.71) +
         f2(time, -345, 0.84, -2.6, 3.24, 6.71)

plot_data <- data.table(
  time = time,
  total = total
)

set.seed(123)

ggplot(plot_data, aes(time)) +
  geom_line(aes(y = total + rnorm(201, 0, 30)), col = "purple", lwd = 1/4) +
  geom_line(aes(y = total + 30), col = "purple", lwd = 1/2, lty = 2) +
  geom_line(aes(y = total - 30), col = "purple", lwd = 1/2, lty = 2) +
  geom_line(aes(y = total), col = "purple", lwd = 1) +
  geom_vline(xintercept = c(6.71, 6.71 + 3.24), lty = 2, col = "gray50") +
  labs(y = "RRi (ms)", x = "Time (min)",
       title = "Your Heart's Epic Journey",
       subtitle = "Simulated and True RRi Signal")
This plot isn’t just a curve, it’s a story. The dip represents your heart’s “oh crap” phase during exercise, while the rebound is its slow return to sanity. The lag (
Why Logistic Functions? Because Your Heart Isn’t Basic
Linear models are the vanilla ice cream of math, safe, predictable, and kinda boring. But your heart? It’s more of a salted caramel espresso swirl. Logistic functions excel here because they handle saturation effects: the idea that your heart rate can’t drop infinitely (you’re not The Flash) or recover instantly (you’re not Wolverine).
The sigmoid shape of
From Math to Medicine: What These Parameters Really Mean
- High
- Low
- Sluggish
- Long
These parameters aren’t just academic, they’re actionable. A low
Behind the Curtain: Stan, HMC, and Bayesian Jedi Tricks
Fitting this model isn’t for the faint of heart. We used Stan (a probabilistic programming language) and Hamiltonian Monte Carlo (HMC) to estimate parameters. Think of HMC as a GPS for navigating the jagged terrain of parameter space, it avoids dead ends and U-turns (thanks, No-U-Turn Sampler!) to find the optimal values.
Translation: We told Stan, “Here’s our equation, here’s our data, and please don’t blow up.” The result? Posterior distributions for each parameter that tell us not just best guesses but uncertainty, like weather forecasts for your heart rate.
Why This Matters?
This model isn’t just a party trick for stats nerds. It’s a bridge between cold, hard data and the messy reality of human physiology. By linking parameters to real-world mechanisms, like sympathetic activation or vagal tone, we can:
- Personalize rehab: Tailor exercises to your autonomic “personality.”
- Detect early risks: Spot sluggish recovery before it becomes a problem.
- Optimize training: Adjust workout intensity based on real-time heart rate dynamics.
Imagine a Fitbit that doesn’t just count steps but whispers, “Hey, your
Your heart isn’t a metronome. It’s a jazz drummer, improvisational, dynamic, and occasionally chaotic. This model embraces that chaos, using logistic functions to map the rhythm of rest, panic, and recovery. Whether you’re a data scientist, a clinician, or someone who just wants to know why burpees feel like death, remember: behind every heartbeat is a story. And now, we’ve got the math to read it.
Implementing Hamiltonian Monte Carlo (HMC)
So, you want to estimate parameters for a fancy heart rate model using HMC? Buckle up, this is like teaching a self-driving car to navigate a maze, but instead of a car, it’s math, and instead of a maze, it’s your heart’s chaotic response to exercise. Let’s break it down without the PhD jargon.
Step 1: What Even Is HMC?
Imagine you’re hiking up a mountain (the “posterior distribution” of parameters you want to explore). Traditional methods like Metropolis-Hastings are like taking random steps blindfolded, you’ll eventually reach the peak, but it’ll take forever. HMC? It’s strapping on a jetpack that uses physics (Hamiltonian dynamics) to glide you smoothly toward high-probability areas.
Here’s the twist:
- Parameters = Positions: Your model’s unknowns (like
- Momentum = Auxiliary Variables: Fake “physics” variables that give your jetpack thrust.
- Hamiltonian = Total Energy: Combines “potential energy” (how badly your model fits the data) and “kinetic energy” (your momentum’s oomph).
You simulate sliding around this energy landscape, guided by gradients (math’s version of GPS), to find the best parameter values.
Step 2: The No-U-Turn Sampler (NUTS): Autopilot for HMC
HMC’s Achilles’ heel? Picking the right step size (
We have already cover the fundamentals of NUTS in a previous post. But, for the sake of time, let’s quickly remember how it works (in case you obviously read my previous post on NUTS):
- Build a Tree: NUTS grows a binary tree of potential steps forward and backward in time.
- Stop at U-Turns: If the path starts doubling back (a “U-turn”), it stops. No wasted steps!
- Adapt Step Size: During warm-up, NUTS adjusts
In our paper, we used Stan (via R’s brms package) to handle this. Stan is like a robot butler that does the math while you sip coffee (or mate1).
1 It’s like coffee but 10 times more intense and face-wrenching
Step 3: Defining the Model, Plugging in the Equation
Okay, all fun and stuff but what is the model? Let’s remember our paper’s model which is a beast:
In brms, you’d write this as a non-linear formula:
library(brms)
model_formula <- bf(
  RRi ~ alpha + beta / (1 + exp(lambda * (time - tau))) +
                (-c * beta) / (1 + exp(phi * (time - tau - delta))),
  alpha ~ 1, beta ~ 1, lambda ~ 1, tau ~ 1, c ~ 1, phi ~ 1, delta ~ 1,
  nl = TRUE
)Translation: “Hey Stan, here’s our equation. The parameters are
Step 4: Setting Priors, Because Even Math Needs Boundaries
Priors keep the parameters from going rogue. For example:
-
-
In brms, you’d set these like:
priors <- c(
  prior(normal(800, 100), nlpar = "alpha"),   # Baseline RR ~800 ms
  prior(normal(-300, 30), nlpar = "beta"),    # Drop magnitude ~-300 ms
  prior(normal(0.8, 0.01), nlpar = "c"),      # Recovery ~80%
  prior(normal(-3, 0.5), nlpar = "lambda"),   # Drop rate ~-3
  prior(normal(-2, 0.5), nlpar = "phi"),      # Recovery rate ~-2
  prior(normal(6, 0.5), nlpar = "tau"),       # Panic starts ~6 min
  prior(normal(3, 0.5), nlpar = "delta")      # Recovery lag ~3 min
)
These priors aren’t wild guesses, they’re based on domain knowledge (or in this case, the paper’s cohort data).
Step 5: Simulating Data, The Noisier the Better
In order to illustrate how our model work and how we can estimate parameters from RRi data, we need data in the first place. Let’s create some fictional RRi data for teaching purposes:
## We create a data.frame with time intervals
data <- data.frame(
  time = seq(0, 20, 0.1)
)

## Then we estimate some arbitrary RRi pattern with added noise
data <- within(data, {
  RRi <- 800 -
    300 / (1 + exp(-3 * (time - 6))) +
    0.8 * 300 / (1 + exp(-2 * (time - 6 - 3))) +
    rnorm(n = length(time), 0, 30)
})
And now that we have cooked some data, let’s see how our simulated RRi pattern looks like:
Step 6: Fitting the Model, Let Stan Do the Heavy Lifting
With the formula, priors, and data ready, fitting the model is anticlimactic:
fit <- brm(
  formula = model_formula,
  data = data,
  prior = priors,
  family = gaussian(),
  chains = 4,         # Run 4 parallel MCMC chains
  iter = 2000,        # 2000 iterations per chain
  warmup = 1000,      # First 1000 are warmup (tuning)
  control = list(adapt_delta = 0.95),  # Be extra careful
  file = "my_rri_model.RDS"
)
Stan will churn through the data, using HMC (via NUTS) to explore the posterior. It’s like training a neural network, but instead of cat pictures, it’s heart rate curves.
Step 7: Checking Convergence, Is the Robot Butler Drunk?
After sampling, you need to check if the chains (parallel runs) agree. Key diagnostics:
- R-hat (
- Effective Sample Size (ESS): Should be >1000. Low ESS? Your jetpack sputtered.
In R:
summary(fit) Family: gaussian
Links: mu = identity; sigma = identity
Formula: RRi ~ alpha + beta/(1 + exp(lambda * (time - tau))) + (-c * beta)/(1 + exp(phi * (time - tau - delta)))
alpha ~ 1
beta ~ 1
lambda ~ 1
tau ~ 1
c ~ 1
phi ~ 1
delta ~ 1
Data: data (Number of observations: 201)
Draws: 4 chains, each with iter = 2000; warmup = 1000; thin = 1;
total post-warmup draws = 4000
Regression Coefficients:
Estimate Est.Error l-95% CI u-95% CI Rhat Bulk_ESS Tail_ESS
alpha_Intercept 800.75 3.45 794.18 807.53 1.00 3052 2914
beta_Intercept -291.16 11.52 -314.42 -269.81 1.00 2077 2512
lambda_Intercept -2.88 0.32 -3.54 -2.30 1.00 3034 2480
tau_Intercept 5.87 0.05 5.77 5.98 1.00 2581 2467
c_Intercept 0.80 0.01 0.79 0.82 1.00 4280 3403
phi_Intercept -2.02 0.26 -2.57 -1.57 1.00 3172 2514
delta_Intercept 3.17 0.12 2.94 3.39 1.00 2401 2769
Further Distributional Parameters:
Estimate Est.Error l-95% CI u-95% CI Rhat Bulk_ESS Tail_ESS
sigma 29.27 1.48 26.59 32.40 1.00 4401 2760
Draws were sampled using sampling(NUTS). For each parameter, Bulk_ESS
and Tail_ESS are effective sample size measures, and Rhat is the potential
scale reduction factor on split chains (at convergence, Rhat = 1).Look for Bulk_ESS and Tail_ESS in the output. If they’re solid, proceed. If not, cry (or increase iter).
Why This Matters?
HMC isn’t just academic flexing. By leveraging gradients (derivatives of the log-posterior), it efficiently explores complex, high-dimensional spaces. Traditional methods would get lost; HMC glides through like it’s on rails.
For the paper, this meant accurately capturing:
- How quickly someone’s heart panics (
- How much it recovers (
- When the panic starts (
These parameters aren’t just numbers, they’re biomarkers. Low
Implementing HMC is like teaching a robot to dance. It’s intricate, requires tuning, and occasionally feels like magic. But with tools like Stan and brms, you don’t need to be a physicist, just a data-savvy human with a problem to solve.
So next time your heart races during a workout, remember: there’s an entire universe of math and code working to understand its tantrums. And that’s kinda beautiful.
Visualizing the Posterior
Let’s face it, statistics can be drier than a saltine cracker. But when you visualize the posterior distributions of your model parameters, magic happens. Suddenly, abstract numbers transform into a story about your heart’s tantrums, resilience, and secret grudges against burpees. Here’s how to decode the math into physiological insights, complete with R code and plots that even your cardio-phobic cousin would understand.
1. Baseline R-R interval (
We’ll start with the posterior density plot for brms and bayesplot, we can visualize where this parameter likely lives:
library(bayesplot)
library(ggplot2)

# Extract posterior samples
posterior_draws <- as_draws_df(fit)

# Plot density with 90% credible interval
mcmc_areas(posterior_draws, pars = "b_alpha_Intercept", prob = 0.9) +
  labs(title = "Baseline R-R interval (α)",
       x = "R-R interval (ms)", y = "Density") +
  theme(axis.text.y.left = element_blank(),
        axis.ticks.y.left = element_blank())
What This Means:
- A peak around 800 ms suggests a resting heart rate of ~75 bpm (since RRi ≈ 60,000 / heart rate).
- A narrow 90% CI (e.g., 795–805 ms) means little uncertainty.
- Physiological Insight: Low
2. Exercise Panic (
Next, let’s plot
# Combine plots
p1 <- mcmc_areas(posterior_draws, pars = "b_beta_Intercept", prob = 0.9) +
  labs(title = "Exercise-Induced Drop (β)",
       x = "Δ R-R interval (ms)", y = "Density") +
  theme(axis.text.y.left = element_blank(),
        axis.ticks.y.left = element_blank())

p2 <- mcmc_areas(posterior_draws, pars = "b_lambda_Intercept", prob = 0.9) +
  labs(title = "Drop Rate (λ)",
       x = "Rate (per min)", y = "Density") +
  theme(axis.text.y.left = element_blank(),
        axis.ticks.y.left = element_blank())

ggpubr::ggarrange(p1, p2, ncol = 2)
What This Means:
- A
- A
- Physiological Insight: A steeper
3. Recovery Parameters (
Now, the recovery phase, where your heart forgives (or doesn’t) your life choices:
# Plot all three
p1 <- mcmc_areas(posterior_draws, pars = "b_c_Intercept", prob = 0.9) +
  labs(title = "Recovery Proportion (c)",
       x = "Proportion of Drop Recovered", y = "Density") +
  theme(axis.text.y.left = element_blank(),
        axis.ticks.y.left = element_blank())

p2 <- mcmc_areas(posterior_draws, pars = "b_phi_Intercept", prob = 0.9) +
  labs(title = "Recovery Rate (φ)",
       x = "Rate (per min)", y = "Density") +
  theme(axis.text.y.left = element_blank(),
        axis.ticks.y.left = element_blank())

p3 <- mcmc_areas(posterior_draws, pars = "b_delta_Intercept", prob = 0.9) +
  labs(title = "Recovery Lag (δ)",
       x = "Lag Time (min)", y = "Density") +
  theme(axis.text.y.left = element_blank(),
        axis.ticks.y.left = element_blank())

ggpubr::ggarrange(p1, p2, p3, nrow = 3)
What This Means:
- Physiological Insight: Low
4. Simulating RRi Curves: From Posteriors to Predictions
Posteriors aren’t just pretty plots, they let us simulate real heartbeats. Let’s generate RRi trajectories using parameter samples:
# Get 100 posterior samples
posterior_samples <- posterior_draws[sample.int(100),]
names(posterior_samples) <- names(posterior_samples) |>
  gsub(pattern = "^b_", replacement = "") |>
  gsub(pattern = "_Intercept$", replacement = "")

# Simulate RRi curves
simulated_rri <- purrr::map_dfr(1:100, function(i) {
  params <- posterior_samples[i, ]
  tibble::tibble(
    time = seq(0, 20, by = 0.1),
    RRi = params$alpha +
          params$beta / (1 + exp(params$lambda * (time - params$tau))) +
          (-params$c * params$beta) / (1 + exp(params$phi * (time - params$tau - params$delta))),
    sim_id = i
  )
})

# Plot spaghetti
ggplot(simulated_rri, aes(time, RRi, group = sim_id)) +
  geom_line(data = data, aes(group = 1), color = "gray") +
  geom_line(alpha = 0.1, color = "purple") +
  labs(title = "100 Simulated RRi Trajectories",
       subtitle = "Compatible with simulated RRi",
       x = "Time (min)", y = "R-R interval (ms)")
What This Means:
- This “spaghetti” plot shows the uncertainty in predictions. Thick bands = high confidence. Gaps = “We’re not very sure what happens here.”
- The U-shape is consistent: sharp drop, lag, then recovery. But the timing and depth vary, reflecting individual differences. Compare it to the simulated R-R signal.
- Physiological Insight: Wider spreads post-exercise (recovery phase) suggest some hearts struggle to bounce back, highlighting candidates for closer monitoring.
5. Correlations Between Parameters: The Autonomic Tug-of-War
Finally, let’s explore how parameters interact using a pairwise correlation plot:
mcmc_pairs(fit, pars = c("b_alpha_Intercept", "b_beta_Intercept",
                         "b_c_Intercept", "b_phi_Intercept"),
           diag_fun = "dens",
           off_diag_fun = "hex")
What This Means:
- Physiological Insight: These relationships hint at autonomic coupling, how sympathetic and parasympathetic systems coordinate.
Why This Matters?
These visualizations aren’t just academic eye candy. They’re tools for:
- Personalized Medicine: Spotting outliers in
- Training Optimization: Athletes with steeper
- Aging Research: The paper’s elderly cohort had slower recovery (
Imagine a clinic where these plots pop up during a stress test, guiding real-time interventions. Or a coach adjusting workouts based on a runner’s recovery lag (
Your heart’s story is written in logistic curves and probability densities. By visualizing the posteriors, we’re not just crunching numbers, we’re decoding the language of life itself. And honestly, that’s way cooler than any Fitbit dashboard.
Discussion: The Bigger Picture
Let’s cut to the chase: hearts are messy. They’re not metronomes, they’re jazz musicians, improvisational, dynamic, and occasionally chaotic. For decades, we’ve tried to shove their rhythms into neat little boxes labeled “heart rate variability” or “linear models,” like forcing a wild stallion into a petting zoo. This paper’s non-linear model isn’t just a math flex; it’s a rebellion against oversimplification. By embracing the chaos of R-R intervals with logistic functions, we’re finally acknowledging that your heart’s response to exercise isn’t a straight line, it’s a rollercoaster. And that matters.
The implications here are bigger than your last Amazon impulse buy. Traditional HRV metrics, while useful, are like summarizing War and Peace as “some Russians had feelings.” They collapse the entire story of your autonomic nervous system into a single number, losing the plot twists, the moment your sympathetic system slams the gas pedal during a sprint, or the parasympathetic system’s slow-mo victory lap post-exercise. Our model captures these nuances, offering a high-definition lens into cardiac dynamics. For clinicians, this could mean spotting early signs of autonomic dysfunction, think diabetes or hypertension, before they escalate. For athletes, it’s a roadmap to optimize recovery. For the rest of us? It’s proof that burpees are, in fact, the devil’s exercise.
But let’s not pop champagne yet. The study’s cohort, elderly individuals, mostly women, is like testing a new sports car on a group of golf cart enthusiasts. While their hearts are marvels of resilience (shoutout to the 70-year-olds out-Zumba-ing millennials), aging inherently alters autonomic function. Younger hearts, with their spry vagal tone and metabolic efficiency, might dance to a different beat. Imagine applying this model to college athletes: would their recovery lag (
Then there’s the elephant in the room: real-world noise. The study’s controlled setting, clean data, preprocessed R-R intervals, is the scientific equivalent of a TikTok dance studio. But life isn’t a lab. Stress, caffeine, and that third espresso you shouldn’t have had all jumble the heart’s signals. Imagine deploying this model in the wild, where wearables battle motion artifacts and Wi-Fi dead zones. Can it handle the chaos? The paper’s synthetic data tests suggest yes, but until it’s stress-tested on Apple Watches dangling off sweaty wrists during CrossFit hell, we’re cautiously optimistic. Integrating real-time environmental factors, temperature, humidity, cortisol levels, could turn this model from a neat trick into a clinical powerhouse.
Speaking of wearables, let’s talk tech. The current Fitbit experience is like having a backseat driver who only knows two phrases: “You’re doing great!” and “Maybe sit down?” Our model could upgrade that to a co-pilot who actually understands your heart’s tantrums. Imagine your smartwatch whispering, “Your recovery proportion (

Now, let’s address the model’s Achilles’ heel: interpretability. Sure, logistic functions are elegant, but explaining them to a cardiologist over coffee is like teaching quantum physics to a golden retriever. The parameters,
And what about the autonomic nervous system’s dark corners? The model assumes a tidy battle between sympathetic and parasympathetic systems, but biology is messy. Emerging research suggests the “sympathovagal balance” is more of a frenemies dynamic, sometimes they collaborate, sometimes they throw shade (Storniolo et al. 2021). Can the model capture that? Not yet. Future iterations might need coupled differential equations or network analysis to untangle the web. Plus, factors like respiratory sinus arrhythmia (where breathing tweaks heart rate) need to be controlled for in this framework. Incorporating these could transform the model from a two-character play into an ensemble drama.
Let’s not forget the ethical tightrope. Personalized health data is a goldmine for innovation, and a minefield for privacy. If your smartwatch knows your heart’s deepest secrets, who else gets a backstage pass? Insurance companies? Employers? The model’s potential is undeniable, but without robust data ethics, we’re one leak away from a Black Mirror episode. Transparency, consent, and encryption aren’t buzzwords, they’re the price of admission.

So, where does this leave us? The paper is a leap forward, but the marathon’s just begun. The road ahead is paved with unanswered questions: (1) Can the model predict cardiac events? (2) How does it interact with other biomarkers like blood pressure or glucose levels? (3) Can it adapt to pathologies like atrial fibrillation? Each step requires collaboration, mathematicians, clinicians, engineers, and yes, even ethicists, to turn this from a cool paper into a lifesaving tool.
In the end, this work isn’t about equations or R2 values. It’s about honoring the heart’s complexity. Your heart isn’t a machine; it’s a storyteller. Each beat whispers tales of stress, joy, fatigue, and resilience. By listening, truly listening, to its non-linear narrative, we’re not just doing science. We’re learning a new language, one that could rewrite the future of healthcare. And honestly, that’s a plot twist worth sticking around for.
Appendix
Check the original paper where the model is presented here.
References
Citation
@misc{castillo-aguilar2025,
  author = {Castillo-Aguilar, Matías},
  title = {So, {You} {Think} {You} {Can} {Model} a {Heartbeat?}},
  date = {2025-03-24},
  url = {https://bayesically-speaking.com/posts/2025-03-24 so-you-think-you-can-model-a-heartbeat/},
  doi = {10.59350/qfn6w-qyt38},
  langid = {en}
}
